Comparison of Vibration Simulation Methods (SDoF vs MDoF) on Light Weighted Distribution Packaging
The following technical paper was presented at ISTA's 2018 Forum held in San Digeo, California. Ricky Speck, PhD
Assistant Professor
Michigan State University School of Packaging
 Patrick McDavid
Instructor
Michigan State University School of Packaging
Introduction
Multi-axis vibration testing has been used in other industries for many years, but the high cost of systems has made their use in packaging unattractive until recently. A growing number of packaging transportation issues in the field that have not been easily replicated in the lab using current industry standards, combined with greater availability of multi-axis systems, has created interest in understanding how multi axis vibration can be used to supplement traditional single-axis vibration testing in packaging labs.
To further the knowledge base of how multi-axis vibration can be utilized to aid packaging research, a study has been conducted looking at the unit load integrity of pallets of light weighted water bottles using both single-axis and multi-axis vibration testing. The study consisted of field data collection of multi-axis vibration data, laboratory testing of product using single and multi-axis PSD based testing, and laboratory testing using single and multi-axis real time playback of field data. The goal of this study is to provide a better understanding of what additional information can be obtained using multi-axis vibration versus single axis, and to help identify information and parameters that need to be defined to better utilize multi-axis testing for distribution packaging.
Background
Motion in the real world is based on 6 degrees-of-freedom (6 DoF): linear horizontal side-to-side motion (x-axis), linear horizontal front-to-back motion (y-axis), linear vertical motion (z-axis), and the rotation around the x-y-z axes (see figure 1). Current test methods for simulating packaging transportation environments employ the use of single-axis vibration testing (1 DoF), predominantly the vertical axis. Testing is done using random vibration based on the vertical Power Spectral Density (PSD) profile of the type of vehicle intended for use in transporting a product. While this methodology has proven to be useful for decades in identifying problems in packaging of products, it has been found to have limitations that impact its effectiveness for some situations.
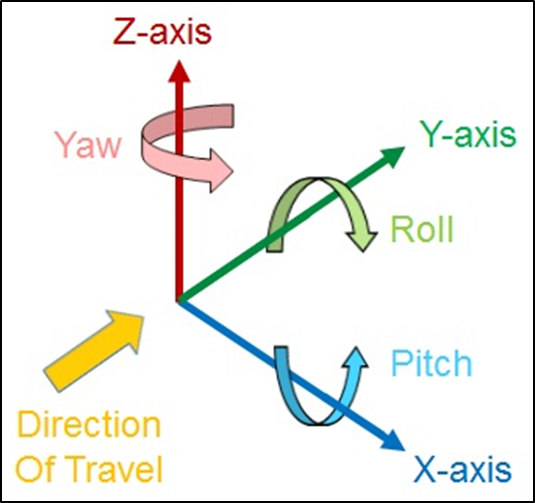
Figure 1; Relationship of yaw, pitch, and roll rotation to X-Y-Z axes.
Batt (2010) found that the vertical axis is not always the most significant contributor to overall motion in a vehicle, the contribution of each axis can vary significantly with frequency. Rouillard (2013) determined that pitch (rotation around the x-axis) and roll (rotation around the y-axis) can be as damaging as vertical vibration in some conditions. Shires (2014) noted that multi-axis testing can generate responses that are not seen when using single-axis testing. Joneson (2017) reported on problems of “dumped” loads in the beverage industry, where pallet integrity of loads that passed single-axis tests was compromised during transport, resulting in loss of containment of the loads (cans breaking loose from the pallet).
The exclusive use of PSD based testing has also been questioned. Kipp (2008) noted that traditional PSD based testing represents an average response, and can smooth out large amplitude damaging motions. Time replication of vibration data recorded from a trip can provide the large amplitude motions missing from PSD based testing, but it has limitations too; Shires (2014) noted that time replication of a single trip is unlikely to adequately represent a complex distribution system.
Method
The study was divided into two phases. Phase 1 dealt with single-axis PSD based testing versus 6 DoF time replication testing of pallets of bottled water. Water was chosen due to its high weight and its reaction to vibration inputs. The pallets contained shrink wrapped packages of 0.5 liter bottled water, with 24 bottles per package. The pallets were picked up from a local retail store, and transported in a 26 foot box truck (see figure 2) over a route between Lansing, MI and Detroit, MI to collect 6 DoF data. Single axis vibration testing was then conducted on new pallets of water at the School of Packaging (SOP) at Michigan State University (MSU) using the ISTA 3E PSD based vibration profile, followed by time replication of the entire trip.
Two pallets of bottled water were loosely secured in the truck with load straps, just in front of the rear axial. The accelerometers were positioned directly behind the pallets. It should be noted that, after some debate, it was decided not to use dunnage to limit the motion of the pallets in the truck as this was seen as the worst case condition. The lack of dunnage occurring in a less-than-truck-load (LTL) delivery was later confirmed when a load of 3 pallets of bottled water were delivered to the SOP for testing without any dunnage or strapping, with load containment failure occurring on all pallets.
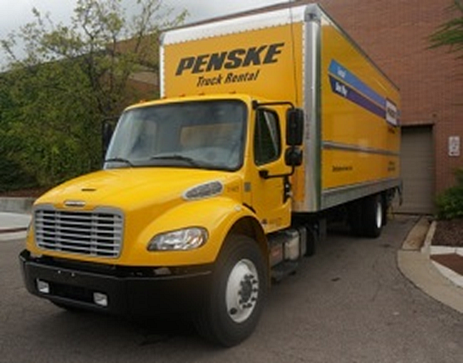
Figure 2; Box truck used in phase 1 multi-axis field data collection.
Once the single axis testing was complete, 6 DoF testing was done on another set of pallets using the vibration table at Adient in Plymouth, MI. The Adient system was originally installed for simulation studies of passenger ride comfort using time replication of road segments representing different driving conditions. Data from the Lansing to Detroit trip was sorted based on the maximum vibration levels in the vertical and horizontal directions, and 11 trip segments containing these maximum vibration events were extracted from the data, each segment covering one to two minutes of the trip. The vibration table drive file for each segment was then created in an iterative process, using sacks of concrete mix as a dummy load on the table, until the cumulative PSD levels from feedback accelerometers on the table were within 10% of the PSD levels of the original trip segment data. This iterative process took considerable time, and the cost effectively limited the time replication to 20 minutes of actual trip data for this study. Once the drive files were created, they could be arranged in any order and repeated any number of times to construct a simulation of the trip. For this study, the 6 DoF simulation consisted of running the drive files in their original time sequenced order for a total of two passes (two 20 minute passes, giving a total of 40 minutes of test time on the table).
Phase 2 of the study dealt with the transport of 20 pallets of bottled water, approximately 48,000 pounds, in a semi-trailer (see figure 3) from a bottling plant in Wytheville, VA to a distribution center in Pikeville, KY. These pallets contained shrink wrapped packages of 0.5 liter bottled water, with 32 bottles per package. The accelerometers were positioned in the rear of the trailer to avoid interfering with the loading pattern used by the bottler. Single-axis (1 DoF) and multi-axis (3 DoF) tests were then conducted on new pallets of bottled water using the Lansmont TruMotion 3 DoF vibration table at Atlantic Packaging in Charlotte, NC. Testing consisted of vertical axis PSD based tests using the ISTA 3E vibration profile, multi-axis PSD based 3 DoF tests using profiles generated from trip acceleration data, and time replication 3 DoF tests using trip acceleration data.
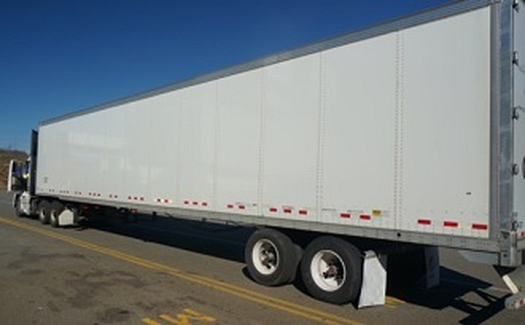
Figure 3; Semi-truck and trailer used in phase 2 multi-axis field data collection.
The time replication tests on the 3 DoF table were done using trip segments selected in a similar manner as that describe for the 6 DoF table; however, the operation of the 3 DoF table required a different form of iterative process than the one used for the 6 DoF table. The controller for the 3 DoF table does several iterations using low level random vibration to determine the transfer function of the table, and then uses that transfer function to control table operation when running the trip segment acceleration files. The pallets of product are on the table during these iterations, so they are subjected to the extra vibration; however, the iteration time is short compared to the time required to produce drive files for the 6 DoF table, and the overall time to do a test is significantly less.
Acceleration data collection in both phases of the study was based on the three point inverted “L” shaped accelerometer configuration shown in figure 4. A Lansmont SAVER 9X data recorder with an internal tri-axial accelerometer was used as the common junction point of the legs of the “L” (Accel 1), and Endevco 2228C tri-axial accelerometers were used as the end points of each leg (Accel 2 and 3). Each accelerometer provided x-y-z axis acceleration data for the point at which it was mounted. Acceleration data was recorded for the three reference points in a synchronous manner, allowing rotational information to be determined by the relative movement of the “L” leg end points versus the common center point of the “L”. Because the trips were short, data was recorded on a continuous basis rather than as discrete events separated in time, providing uninterrupted coverage of the movement of the truck from start to finish. A sample rate of 1,000 samples per second per channel was used for phase 1. The sample rate for phase 2 was reduced to 500 samples per second per channel to increase the recording time, which allowed coverage of the entire trip from Virginia to Kentucky.
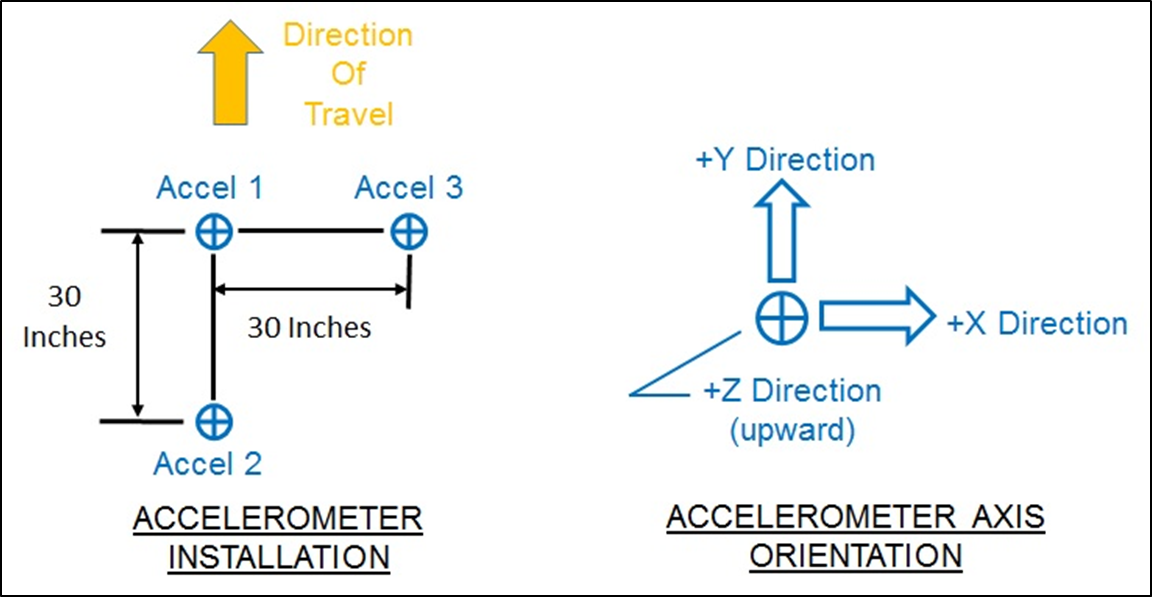
Figure 4; Accelerometer configuration used for multi-axis field data collection.
In addition to acceleration data, a global position system (GPS) and several video cameras were used to record each trip. GPS coordinates allow every shock and vibration event to be mapped to an exact location on a route. Video of the truck and the pallets provides a means to correlate truck motion to the motion of the pallets and their contents within the truck/trailer. The videos also allow for comparison of the movement of the pallets on the vibration tables to their motion in the truck/trailer, a useful aspect when determining the effectiveness of multi-axis vibration in simulating the transport environment.
Phase 1 Results
During field data collection for phase 1, 24 packs of bottled water from two different suppliers were found to shift position on the pallets, to the point of losing containment of the unit loads, as shown in figure 5. In reviewing video and GPS data, it was observed that the loads on the pallets shifted back and forth several times leading up to the loss of containment, with the final collapses occurring on two different 90 degree turns, see figure 6. Inspection of one pallet revealed that bottles on the bottom layers had started to lean outward, see figure 7, and the stretch wrapping of the pallets had not been able to stop the progression of the lean, leading to instability of the unit load. Inspection of the other pallet found the load of bottles had shifted horizontally until the leading row of bottles no longer had support from the pallet, see figure 8.
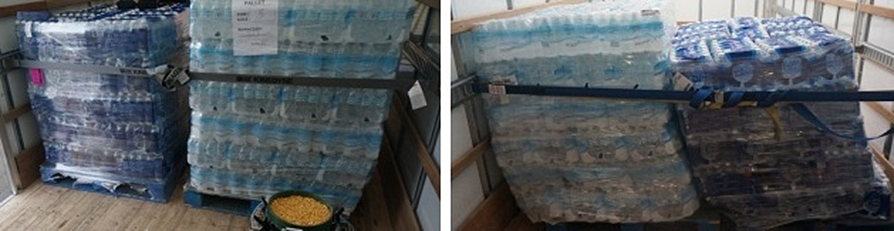
Figure 5; Phase 1 pallets of bottled water (left: front view before road trip, right: rear view after).
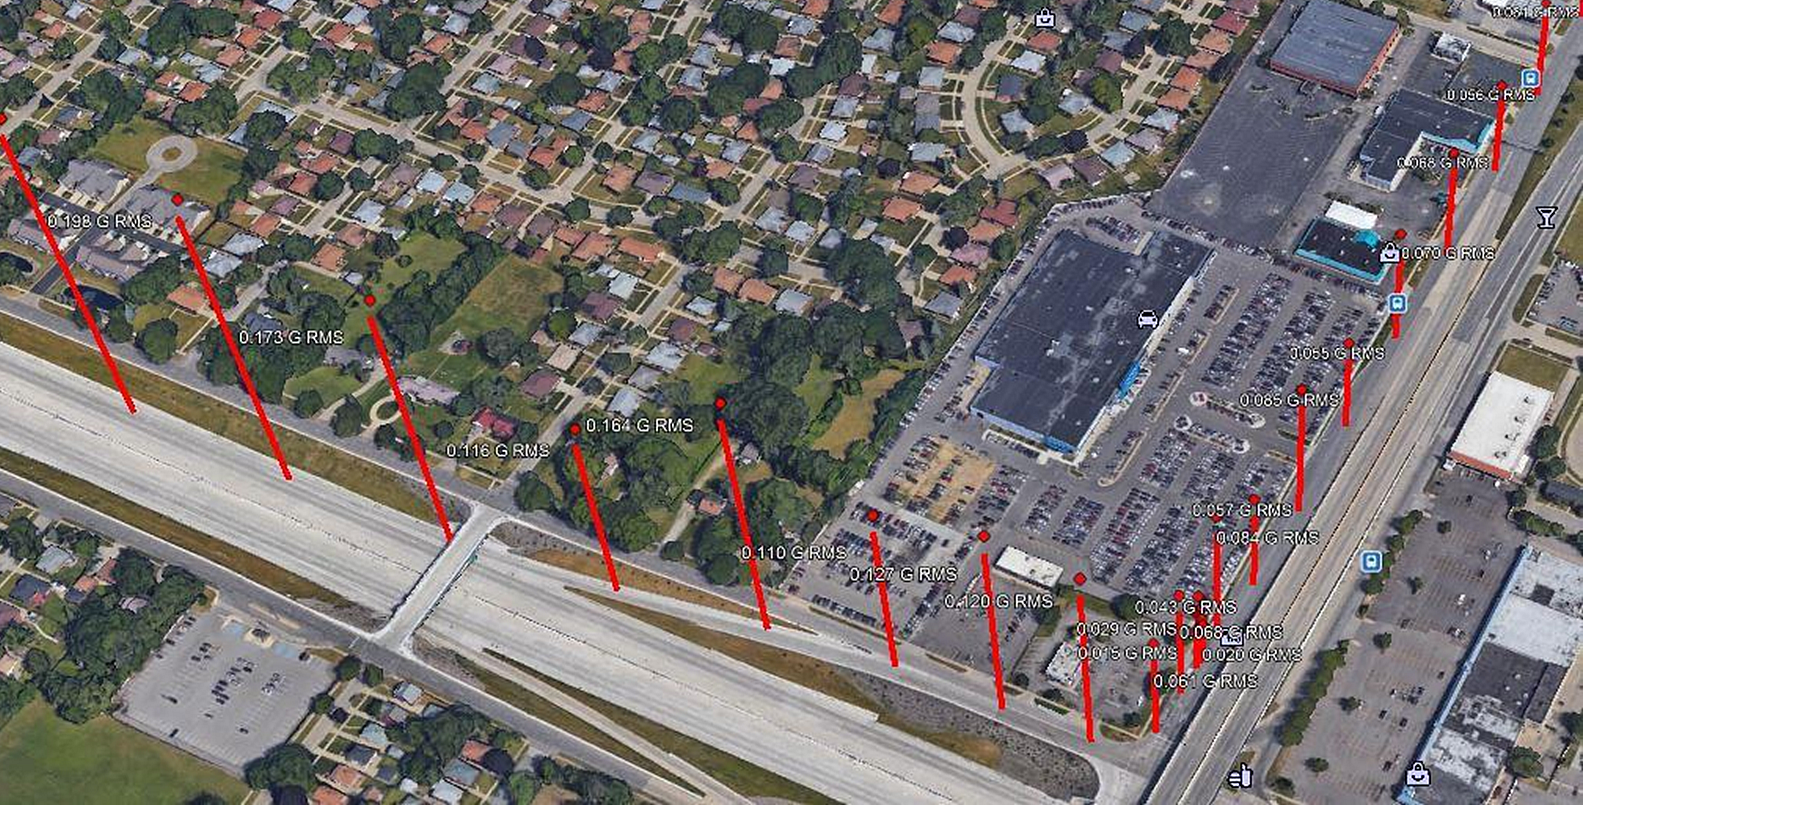
Figure 6; Phase 1 GPS data showing turn where second pallet lost containment.
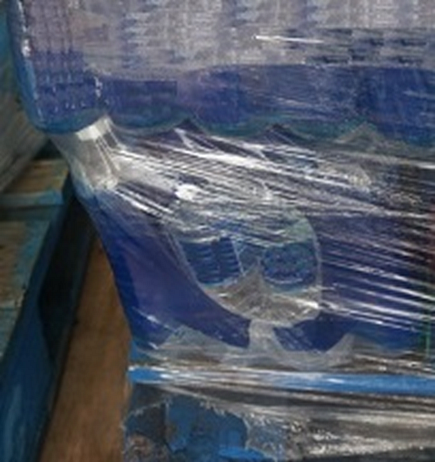
Figure 7; Outward lean of water bottles on bottom layer of pallet.
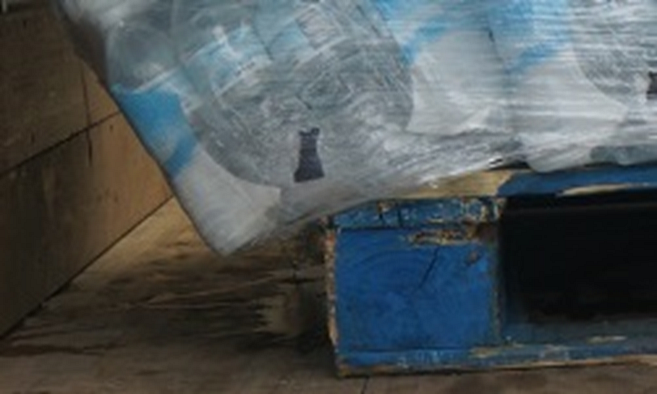
Figure 8; Row of bottles on bottom layer no longer supported by pallet.
In conducting single axis vibration testing, it was found that neither the ISTA 3E vibration profile or the subsequent time replication of the entire trip had any significant effect. No lateral motion of the load was observed, and there were no signs that containment loss would be an issue. This proved to be the case even when testing was done using pallets where the loads were already leaning slightly before being placed on the vibration table, see figure 9.
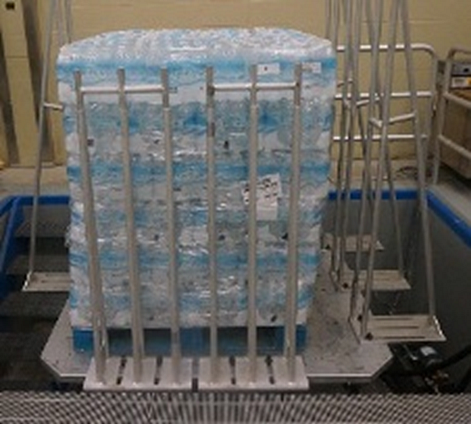
Figure 9; Vertical axis vibration testing of water bottles leaning to right on pallet.
6 DoF multi-axis testing on new pallets of product did not result in any load containment failures; however, substantial lateral motion was noted between layers of 24 packs of bottled water. The layers shifted back and forth relative to each other, which could stress the ability of the stretch wrap to contain the load, but no cumulative effect was seen. It was noted that the bottles on the bottom layers leaned inward during tests, but could only lean a small amount before being blocked by other bottles, see figure 10. The bottles on lower layers of pallets in the field test had leaned outward, with only the stretch wrap to limit the amount of lean.
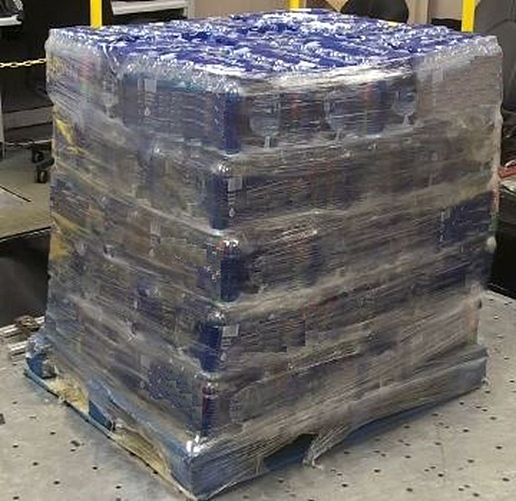
Figure 10; Multi-axis testing where water bottles on lower layers leaned slightly inward.
Phase 2 Results
There was no failure of unit load containment during field data collection for phase 2; however, a substantial lean of product toward the side of the trailer did develop on one pallet, see figure 11. Review of GPS and video data showed the route had many steep downhill curves, and that significant lateral swaying of unit loads occurred. Video also showed that several pallets had experienced repeated left-right lateral sway. No dunnage was used in the trailer, and a single strap had been placed in the trailer to minimize front-back pallet movement. Generally, two pallets were placed side-by-side across the width of the truck, allowing the pair of pallets to limit each other’s lateral movement to some degree, but still leaving room for lateral movement in the space between the pallets and the trailer walls.
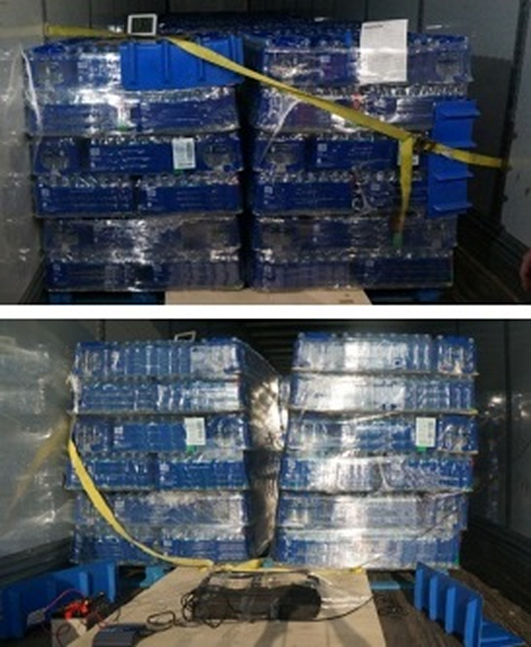
Figure 11; Phase 2 pallets of bottled water (top: before road trip, bottom: after).
Several pallets of bottled water delivered to Atlantic Packaging for vibration testing were found to have significant tears in the shrink wrap. A pallet that appeared to be in good shape was selected for single axis vibration testing, and quickly developed such a substantial lean while using the ISTA 3E vibration profile that testing was halted to prevent collapse of the load. Inspection of the pallet revealed that the stretch wrap connecting layers on the pallet appeared insufficient. A second pallet was selected and subjected to the ISTA 3E test with close attention being paid to how the layers interacted. The layers started sliding against each other and a substantial lean quickly developed. At this point it was decided that the pallets would have to be rewrapped before any more testing could be done.
After analyzing the stretch wrap material and wrapping pattern that had been used on the pallets, it was decided to rewrap some pallets in a similar manner, and to take the opportunity to rewrap other pallets in a different method that was viewed as being more likely to interconnect the layers better. The new wrapping pattern used a wider wrap, but kept the material similar, and kept the same total weight of material used. Pallets using the original wrapping pattern and the new wrapping pattern were then tested side-by-side on the vibration table. No containment failures occurred; however, when running 3 DoF multi-axis vibration tests it was found that pallets with the original wrapping pattern exhibited significantly larger amounts of lateral swaying at the top than the pallets with the new wrapping pattern, see Figure 12.
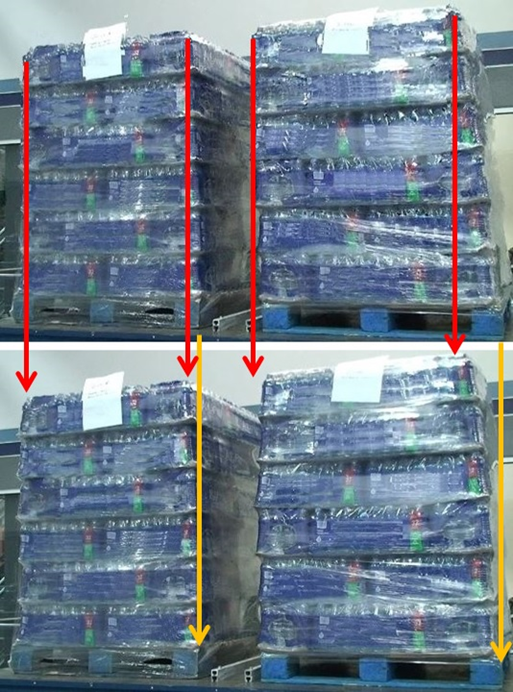
Figure 12; Two frames of video taken by a camera on a fixed mount showing pallet load swaying. Red arrows show top of right pallet misaligned between frames, while left pallet stays aligned. Yellow arrows show bottom of pallets remain aligned between frames.
Conclusions
This study has shown the use of multi-axis vibration testing can provide useful insights in how unit load distribution packaging reacts to real world motion. This study began as a comparison of light weighted bottles, but throughout the project we recognized the roll that the stretch wrap and unitization methods play in unit load stability. While no containment failures were replicated using multi-axis testing in this study, potentially significant lateral motions of unit loads were present in multi-axis transport simulations that were not observable in vertical axis simulations. Phase 1 multi-axis testing showed a lateral back and forth motion of product that could, over time, stress and loosen the stretch wrap containing the load in a manner not seen in vertical testing. Phase 2 multi-axis testing mimicked the lateral swaying motion of loads that were visible in video from the trailer, but not in vertical testing, allowing a visual comparison of the effectiveness of using a different stretch wrapping pattern to control this movement. Work in this area is going to continue as we strive to identify the tools to record and replicate the results we experienced in the field in both phases, and in the attempted delivery of pallets to the School of Packaging.
References
Batt, G., 2010, “Use of Simultaneous Three Axis Vibration in Simulating the Transport Environment”, Presented at ISTA International Transport Packaging Forum.
Joneson, E., 2017, “Over-The-Road Load Shift Investigative Case Study”, Presented at ISTA TransPack Forum.
Kipp, B., 2008, “New Considerations For Random Vibration Testing Of Packaged-Products”, Presented at ISTA International Transport Packaging Forum.
Rouillard, V., 2013, “Some Observations On The Heave, Pitch, and Roll Vibration of Road Transport Vehicles”, Presented at ISTA TransPack Forum.
Shires, D., 2014, “Methodologies For Vibration Testing Packaged-Products”, Available from International Safe Transit Association, East Lansing, MI, USA.
Acknowledgements
Funding for this study was provided by the Center for Packaging Innovation and Sustainability.
The authors would like to thank the following people and their companies for their assistance, without which this study would not have been possible.
©2018 ISTA TransPack Forum. All rights reserved.
Multi-axis vibration testing has been used in other industries for many years, but the high cost of systems has made their use in packaging unattractive until recently. A growing number of packaging transportation issues in the field that have not been easily replicated in the lab using current industry standards, combined with greater availability of multi-axis systems, has created interest in understanding how multi axis vibration can be used to supplement traditional single-axis vibration testing in packaging labs.
To further the knowledge base of how multi-axis vibration can be utilized to aid packaging research, a study has been conducted looking at the unit load integrity of pallets of light weighted water bottles using both single-axis and multi-axis vibration testing. The study consisted of field data collection of multi-axis vibration data, laboratory testing of product using single and multi-axis PSD based testing, and laboratory testing using single and multi-axis real time playback of field data. The goal of this study is to provide a better understanding of what additional information can be obtained using multi-axis vibration versus single axis, and to help identify information and parameters that need to be defined to better utilize multi-axis testing for distribution packaging.
Background
Motion in the real world is based on 6 degrees-of-freedom (6 DoF): linear horizontal side-to-side motion (x-axis), linear horizontal front-to-back motion (y-axis), linear vertical motion (z-axis), and the rotation around the x-y-z axes (see figure 1). Current test methods for simulating packaging transportation environments employ the use of single-axis vibration testing (1 DoF), predominantly the vertical axis. Testing is done using random vibration based on the vertical Power Spectral Density (PSD) profile of the type of vehicle intended for use in transporting a product. While this methodology has proven to be useful for decades in identifying problems in packaging of products, it has been found to have limitations that impact its effectiveness for some situations.
Figure 1; Relationship of yaw, pitch, and roll rotation to X-Y-Z axes.
Batt (2010) found that the vertical axis is not always the most significant contributor to overall motion in a vehicle, the contribution of each axis can vary significantly with frequency. Rouillard (2013) determined that pitch (rotation around the x-axis) and roll (rotation around the y-axis) can be as damaging as vertical vibration in some conditions. Shires (2014) noted that multi-axis testing can generate responses that are not seen when using single-axis testing. Joneson (2017) reported on problems of “dumped” loads in the beverage industry, where pallet integrity of loads that passed single-axis tests was compromised during transport, resulting in loss of containment of the loads (cans breaking loose from the pallet).
The exclusive use of PSD based testing has also been questioned. Kipp (2008) noted that traditional PSD based testing represents an average response, and can smooth out large amplitude damaging motions. Time replication of vibration data recorded from a trip can provide the large amplitude motions missing from PSD based testing, but it has limitations too; Shires (2014) noted that time replication of a single trip is unlikely to adequately represent a complex distribution system.
Method
The study was divided into two phases. Phase 1 dealt with single-axis PSD based testing versus 6 DoF time replication testing of pallets of bottled water. Water was chosen due to its high weight and its reaction to vibration inputs. The pallets contained shrink wrapped packages of 0.5 liter bottled water, with 24 bottles per package. The pallets were picked up from a local retail store, and transported in a 26 foot box truck (see figure 2) over a route between Lansing, MI and Detroit, MI to collect 6 DoF data. Single axis vibration testing was then conducted on new pallets of water at the School of Packaging (SOP) at Michigan State University (MSU) using the ISTA 3E PSD based vibration profile, followed by time replication of the entire trip.
Two pallets of bottled water were loosely secured in the truck with load straps, just in front of the rear axial. The accelerometers were positioned directly behind the pallets. It should be noted that, after some debate, it was decided not to use dunnage to limit the motion of the pallets in the truck as this was seen as the worst case condition. The lack of dunnage occurring in a less-than-truck-load (LTL) delivery was later confirmed when a load of 3 pallets of bottled water were delivered to the SOP for testing without any dunnage or strapping, with load containment failure occurring on all pallets.
Figure 2; Box truck used in phase 1 multi-axis field data collection.
Once the single axis testing was complete, 6 DoF testing was done on another set of pallets using the vibration table at Adient in Plymouth, MI. The Adient system was originally installed for simulation studies of passenger ride comfort using time replication of road segments representing different driving conditions. Data from the Lansing to Detroit trip was sorted based on the maximum vibration levels in the vertical and horizontal directions, and 11 trip segments containing these maximum vibration events were extracted from the data, each segment covering one to two minutes of the trip. The vibration table drive file for each segment was then created in an iterative process, using sacks of concrete mix as a dummy load on the table, until the cumulative PSD levels from feedback accelerometers on the table were within 10% of the PSD levels of the original trip segment data. This iterative process took considerable time, and the cost effectively limited the time replication to 20 minutes of actual trip data for this study. Once the drive files were created, they could be arranged in any order and repeated any number of times to construct a simulation of the trip. For this study, the 6 DoF simulation consisted of running the drive files in their original time sequenced order for a total of two passes (two 20 minute passes, giving a total of 40 minutes of test time on the table).
Phase 2 of the study dealt with the transport of 20 pallets of bottled water, approximately 48,000 pounds, in a semi-trailer (see figure 3) from a bottling plant in Wytheville, VA to a distribution center in Pikeville, KY. These pallets contained shrink wrapped packages of 0.5 liter bottled water, with 32 bottles per package. The accelerometers were positioned in the rear of the trailer to avoid interfering with the loading pattern used by the bottler. Single-axis (1 DoF) and multi-axis (3 DoF) tests were then conducted on new pallets of bottled water using the Lansmont TruMotion 3 DoF vibration table at Atlantic Packaging in Charlotte, NC. Testing consisted of vertical axis PSD based tests using the ISTA 3E vibration profile, multi-axis PSD based 3 DoF tests using profiles generated from trip acceleration data, and time replication 3 DoF tests using trip acceleration data.
Figure 3; Semi-truck and trailer used in phase 2 multi-axis field data collection.
The time replication tests on the 3 DoF table were done using trip segments selected in a similar manner as that describe for the 6 DoF table; however, the operation of the 3 DoF table required a different form of iterative process than the one used for the 6 DoF table. The controller for the 3 DoF table does several iterations using low level random vibration to determine the transfer function of the table, and then uses that transfer function to control table operation when running the trip segment acceleration files. The pallets of product are on the table during these iterations, so they are subjected to the extra vibration; however, the iteration time is short compared to the time required to produce drive files for the 6 DoF table, and the overall time to do a test is significantly less.
Acceleration data collection in both phases of the study was based on the three point inverted “L” shaped accelerometer configuration shown in figure 4. A Lansmont SAVER 9X data recorder with an internal tri-axial accelerometer was used as the common junction point of the legs of the “L” (Accel 1), and Endevco 2228C tri-axial accelerometers were used as the end points of each leg (Accel 2 and 3). Each accelerometer provided x-y-z axis acceleration data for the point at which it was mounted. Acceleration data was recorded for the three reference points in a synchronous manner, allowing rotational information to be determined by the relative movement of the “L” leg end points versus the common center point of the “L”. Because the trips were short, data was recorded on a continuous basis rather than as discrete events separated in time, providing uninterrupted coverage of the movement of the truck from start to finish. A sample rate of 1,000 samples per second per channel was used for phase 1. The sample rate for phase 2 was reduced to 500 samples per second per channel to increase the recording time, which allowed coverage of the entire trip from Virginia to Kentucky.
Figure 4; Accelerometer configuration used for multi-axis field data collection.
In addition to acceleration data, a global position system (GPS) and several video cameras were used to record each trip. GPS coordinates allow every shock and vibration event to be mapped to an exact location on a route. Video of the truck and the pallets provides a means to correlate truck motion to the motion of the pallets and their contents within the truck/trailer. The videos also allow for comparison of the movement of the pallets on the vibration tables to their motion in the truck/trailer, a useful aspect when determining the effectiveness of multi-axis vibration in simulating the transport environment.
Phase 1 Results
During field data collection for phase 1, 24 packs of bottled water from two different suppliers were found to shift position on the pallets, to the point of losing containment of the unit loads, as shown in figure 5. In reviewing video and GPS data, it was observed that the loads on the pallets shifted back and forth several times leading up to the loss of containment, with the final collapses occurring on two different 90 degree turns, see figure 6. Inspection of one pallet revealed that bottles on the bottom layers had started to lean outward, see figure 7, and the stretch wrapping of the pallets had not been able to stop the progression of the lean, leading to instability of the unit load. Inspection of the other pallet found the load of bottles had shifted horizontally until the leading row of bottles no longer had support from the pallet, see figure 8.
Figure 5; Phase 1 pallets of bottled water (left: front view before road trip, right: rear view after).
Figure 6; Phase 1 GPS data showing turn where second pallet lost containment.
Figure 7; Outward lean of water bottles on bottom layer of pallet.
Figure 8; Row of bottles on bottom layer no longer supported by pallet.
In conducting single axis vibration testing, it was found that neither the ISTA 3E vibration profile or the subsequent time replication of the entire trip had any significant effect. No lateral motion of the load was observed, and there were no signs that containment loss would be an issue. This proved to be the case even when testing was done using pallets where the loads were already leaning slightly before being placed on the vibration table, see figure 9.
Figure 9; Vertical axis vibration testing of water bottles leaning to right on pallet.
6 DoF multi-axis testing on new pallets of product did not result in any load containment failures; however, substantial lateral motion was noted between layers of 24 packs of bottled water. The layers shifted back and forth relative to each other, which could stress the ability of the stretch wrap to contain the load, but no cumulative effect was seen. It was noted that the bottles on the bottom layers leaned inward during tests, but could only lean a small amount before being blocked by other bottles, see figure 10. The bottles on lower layers of pallets in the field test had leaned outward, with only the stretch wrap to limit the amount of lean.
Figure 10; Multi-axis testing where water bottles on lower layers leaned slightly inward.
Phase 2 Results
There was no failure of unit load containment during field data collection for phase 2; however, a substantial lean of product toward the side of the trailer did develop on one pallet, see figure 11. Review of GPS and video data showed the route had many steep downhill curves, and that significant lateral swaying of unit loads occurred. Video also showed that several pallets had experienced repeated left-right lateral sway. No dunnage was used in the trailer, and a single strap had been placed in the trailer to minimize front-back pallet movement. Generally, two pallets were placed side-by-side across the width of the truck, allowing the pair of pallets to limit each other’s lateral movement to some degree, but still leaving room for lateral movement in the space between the pallets and the trailer walls.
Figure 11; Phase 2 pallets of bottled water (top: before road trip, bottom: after).
Several pallets of bottled water delivered to Atlantic Packaging for vibration testing were found to have significant tears in the shrink wrap. A pallet that appeared to be in good shape was selected for single axis vibration testing, and quickly developed such a substantial lean while using the ISTA 3E vibration profile that testing was halted to prevent collapse of the load. Inspection of the pallet revealed that the stretch wrap connecting layers on the pallet appeared insufficient. A second pallet was selected and subjected to the ISTA 3E test with close attention being paid to how the layers interacted. The layers started sliding against each other and a substantial lean quickly developed. At this point it was decided that the pallets would have to be rewrapped before any more testing could be done.
After analyzing the stretch wrap material and wrapping pattern that had been used on the pallets, it was decided to rewrap some pallets in a similar manner, and to take the opportunity to rewrap other pallets in a different method that was viewed as being more likely to interconnect the layers better. The new wrapping pattern used a wider wrap, but kept the material similar, and kept the same total weight of material used. Pallets using the original wrapping pattern and the new wrapping pattern were then tested side-by-side on the vibration table. No containment failures occurred; however, when running 3 DoF multi-axis vibration tests it was found that pallets with the original wrapping pattern exhibited significantly larger amounts of lateral swaying at the top than the pallets with the new wrapping pattern, see Figure 12.
Figure 12; Two frames of video taken by a camera on a fixed mount showing pallet load swaying. Red arrows show top of right pallet misaligned between frames, while left pallet stays aligned. Yellow arrows show bottom of pallets remain aligned between frames.
Conclusions
This study has shown the use of multi-axis vibration testing can provide useful insights in how unit load distribution packaging reacts to real world motion. This study began as a comparison of light weighted bottles, but throughout the project we recognized the roll that the stretch wrap and unitization methods play in unit load stability. While no containment failures were replicated using multi-axis testing in this study, potentially significant lateral motions of unit loads were present in multi-axis transport simulations that were not observable in vertical axis simulations. Phase 1 multi-axis testing showed a lateral back and forth motion of product that could, over time, stress and loosen the stretch wrap containing the load in a manner not seen in vertical testing. Phase 2 multi-axis testing mimicked the lateral swaying motion of loads that were visible in video from the trailer, but not in vertical testing, allowing a visual comparison of the effectiveness of using a different stretch wrapping pattern to control this movement. Work in this area is going to continue as we strive to identify the tools to record and replicate the results we experienced in the field in both phases, and in the attempted delivery of pallets to the School of Packaging.
References
Batt, G., 2010, “Use of Simultaneous Three Axis Vibration in Simulating the Transport Environment”, Presented at ISTA International Transport Packaging Forum.
Joneson, E., 2017, “Over-The-Road Load Shift Investigative Case Study”, Presented at ISTA TransPack Forum.
Kipp, B., 2008, “New Considerations For Random Vibration Testing Of Packaged-Products”, Presented at ISTA International Transport Packaging Forum.
Rouillard, V., 2013, “Some Observations On The Heave, Pitch, and Roll Vibration of Road Transport Vehicles”, Presented at ISTA TransPack Forum.
Shires, D., 2014, “Methodologies For Vibration Testing Packaged-Products”, Available from International Safe Transit Association, East Lansing, MI, USA.
Acknowledgements
Funding for this study was provided by the Center for Packaging Innovation and Sustainability.
The authors would like to thank the following people and their companies for their assistance, without which this study would not have been possible.
- Michelle Bryson and Kamal Mahajan of PepsiCo for the donation of pallets of bottled water.
- Eric Joneson of NVT Group (Lansmont).
- Kyle Dunno of Atlantic Packaging.
- Michael Szott of Adient.
©2018 ISTA TransPack Forum. All rights reserved.